There have been over 20,000 players in Major League Baseball history. Even if just 10% can be considered above-average, we’re looking at a list longer than the end credits of The Lord of the Rings: Return of the King. To get that list down to 100 requires identifying the right combination of performance and longevity, with the caveat that the more elite seasons a player has, the less longevity is a requirement. For the few who “hit it out of the park” in both categories, it’s a Disney FastPass to the front of the line. For those who stray too far to one side or the other, it’s a lifetime membership to the Jelly of the Month Club.
Dave Winfield amassed impressive raw totals over 22 seasons but falls just short of inclusion. Despite 3,110 career hits, Winfield produced only one season with a WAR greater than 5.4 and finished in the top-10 in the league in WAR just once. While the balance is not quite there for Winfield, it is just barely there for Eddie Murray. Murray matches Winfield’s longevity while outperforming him in Baseball Reference’s Black Ink and Gray Ink tests.
The Murray/Winfield comparison is an important one because it shows just how razor-thin the difference can be between being on the right side of the top-100 and the wrong side. According to Bill James’s similarity score, of all the players in MLB history, the player whose career closest resembles Winfield’s is Murray. Fortunately, the closer we hold the magnifying glass to the numbers, the more we find tangible separation. The answer is always there, even it’s not always the first thing we see. This head-to-head comparison is just one of the thousands that went into creating the top-100. Although it would be nice to be able to simply state a minimum requirement for both peak and longevity, there have been too many great baseball careers with too many distinct resumes to be able to do that. Instead, answering the following set of questions helps us narrow in on the elusive sweet spot…
1). What era did the player play in?
This question establishes a “degree of difficulty” factor, bringing context to player achievements. Succeeding in a small, racially segregated league is much easier than succeeding in a large, racially diverse league. Eddie Collins is a Hall of Fame second baseman who amassed 3,315 career hits over 25 years from 1906-1930. He is 11th all-time in hits, 8th all-time in stolen bases, and 13th all-time in WAR. There is no doubt that Collins was one of the top-100 players of all-time, even as recently as the end of the 20th century. While Collins’ resume was strong enough to buoy him for 70+ years, it was the relatively weak competition level of his era that eventually did him in. Given the small number of teams (8) in the American League at the time, and the fact that black and Latino players were banned from playing in MLB, Collins would’ve needed a resume with substantially more league-leading accomplishments than the best players from more competitive eras. According to Baseball Reference’s Black Ink Test, that didn’t happen. Collins scores just 19, which is good for only 122nd all-time among position players. A 19 isn’t necessarily a poor score taken at face value—it’s actually better than the scores of a number of players who made the top-100—it’s the fact that it was achieved during the least competitive era in MLB history that is the issue. Given the significant increase in degree-of-difficulty that players post-segregation have faced, Collin’s Black Ink score and overall resume simply don’t hold up against the likes of Dick Allen (27), Larry Walker (24), and Kirby Puckett (22), none of whom break the top-100.
Further alienating Collins’ case is the fact that the best players from his era all score astronomically high on the Black Ink Test, which would be the expectation given how much easier it was to lead the league than in any other era. In fact, six of the top ten Black Ink totals of all-time among position-players come from players who played with Collins, including Babe Ruth (157), Ty Cobb (154), Rogers Hornsby (125), Honus Wagner (105), Nap Lajoie (76), and Lou Gehrig (75). Collins was a good player to be sure, but there is a clear delineation between the elite players of the early 1900s and the good players.
On the other hand, modern players who score high on the Black Ink test do so in the most difficult era in MLB history. Unlike the players from the first half of the 20th century, contemporary players play in a league almost twice the size and do so against the largest talent pool MLB has ever seen. Leading the league is more difficult now than it has ever been, which makes recent players who have routinely led the league in important categories more impressive than their predecessors with equal accomplishments. Roger Clemens (100), Randy Johnson (99), Greg Maddux (87), Mike Schmidt (74), Barry Bonds (69), and Alex Rodriguez (68), might not have the Black Ink totals to rival the best players of the segregation era, but their totals are actually more impressive given the environment in which they were achieved.
2). How many elite seasons did the player have?
It is crucial that we reward elite performance, first and foremost, before we consider career marks since the latter can merely be a function of longevity. 300 wins, 500 home runs, and 3,000 hits are milestones that have been burned into the brain of every kid who has ever obsessively scanned the back of a baseball card. While those marks are revered—and largely for good reason—many of the greatest players in baseball history have not come close to reaching them. Either due to injury, military service, or late-development, most players don’t have the luxury of playing long enough to reach those numbers. So, we need a different way to measure greatness, or we run the risk of confusing longevity with greatness.
Despite being one of the elite players in MLB for over a decade, Albert Pujols didn’t achieve a 4 WAR-season after 2012, and he was worse than a bench player from 2016-2020. Yet, over that time, he passed the 500 and 600 home run milestones, reached 3,000 hits, 2,000 RBIs, and inched past 100 career WAR. Had Pujols retired when he stopped being a productive player, his counting stats wouldn’t look as impressive as they do today, yet the Angels almost certainly would have been more successful without him. The point here isn’t that Pujols wasn’t a great player (he was), rather it’s that we need to acknowledge that he was an elite player for 12 seasons and a mediocre-to-poor player for nine seasons. Sticking around for nine seasons to hit aesthetically pleasing career counting stats didn’t make him a better player.
Unlike Pujols, there are a number of players who retired either right at or just before the point at which they stopped being productive. Pedro Martinez, Jeff Bagwell, Vlad Guerrero, and Roy Halladay are just a few examples. If Bagwell or Guerrero had chosen to play an extra five seasons as below average players, they likely would’ve reached 3,000 hits and 500 home runs. When deliberating a player’s place in history, it’s important that we avoid rewarding players for seasons after becoming unproductive and, conversely, punishing players for not sticking around long enough to become a drain on their teams.
Unfortunately, our love affair with career milestones has resulted in really good players being overlooked, none more than Johan Santana. Over 12 seasons, Santana posted a lofty .641 winning percentage, which is the 10th best mark of all pitchers debuting since 1960 (min. 10 seasons). His 136 ERA+ is the 5th highest in the last 100 years (min. 10 seasons). Santana is the only player in MLB history to lead the league in ERA+, WHIP, H/9, strikeouts, and SO/9 in three consecutive seasons. He is one of only four pitchers to lead the league in WHIP for four consecutive seasons (Carl Hubbell, Sandy Koufax, and Clayton Kershaw). Since 1920, he is the only pitcher to lead the league in wins, ERA, strikeouts, innings, games started, ERA+, WHIP, H/9, and SO/9 in the same season. He is one of only seven players to lead the league in ERA+ for three consecutive seasons (Christy Mathewson, Lefty Grove, Roger Clemens, Greg Maddux, Randy Johnson, and Clayton Kershaw). Since 1920, he is one of only four pitchers to lead the league in H/9 for three consecutive seasons (Bob Feller, Sandy Koufax, and Nolan Ryan).
Yet, not only is Santana rarely, if ever, considered among the top 100 players of all-time, he was resoundingly rejected by Hall of Fame voters to the tune of a paltry 2.4% approval. Meanwhile, Sandy Koufax and Hank Greenberg—who, like Santana, didn’t quite nail the longevity component—are celebrated Hall of Famers and routinely included on top-100 lists, despite playing in significantly less competitive eras. If we’re not going to hold it against Koufax and Greenberg, then we probably shouldn’t hold it against Santana.
3). How often did the player lead the league in important categories?
Irrespective of the wide variance in competition levels throughout MLB history, one constant threads all eras: the best players lead the league in the most important categories the most often. The Black Ink Test is a good place to start due to its relative simplicity, but it’s also somewhat limited for the same reason. While the Black Ink Test assigns anywhere from 1-4 points for leading the league in each of 12 different categories, it assigns zero points for leading the league in on-base percentage, OPS+, totals bases, and WAR, which are four of the most valuable tools we have for player comparisons. Adding these four categories to the Black Ink Test gives us a pretty comprehensive snapshot of a player’s contributions, or lack thereof.
Some of the early 20th century players who have been seemingly rubber-stamped on every top-100 list since the beginning of time probably shouldn’t be. Players like Eddie Collins, Shoeless Joe Jackson, Al Simmons, Paul Waner, Eddie Plank, Harry Heilman, and George Sisler perform poorly on the Black Ink Test compared to their contemporaries. Given that it was considerably easier to lead the league in that era than in any other due to league size and the homogenous makeup of the player pool, the fact that these players perform so poorly on the Black Ink Test makes it hard to justify including them in the top-100.
4). How often did the player finish among the league leaders in important categories?
While leading the league in statistical categories is the gold standard for finding the best players, identifying players who routinely finished among the leaders is also a revealing exercise. For those players whose Black Ink Test looks more like a Blank Ink test, we have Baseball Reference’s Gray Ink Test. The Gray Ink Test measures how often a player finished in the top-10 in important statistical categories. Like the Black Ink Test, we benefit from making a few minor adjustments. In addition to adding on-base percentage, OPS+, total bases, and WAR, we can also get a higher-caliber player by limiting the test to top-5 finishes rather than top-10.
It’s also important to recognize that these tests are only useful when comparing players who played in similarly-sized leagues since it becomes more difficult to finish among the league leaders the larger the league grows. It’s no coincidence that the majority of the top-100 Gray Ink scores of all-time come from players who played when the league was roughly half the size it is today. Since it is more difficult to finish among the league leaders than it ever has been before, contemporary players are producing lower Black Ink and Gray Ink scores than ever before. If we rely solely on these tests without context, players like Chipper Jones and Jim Thome appear underwhelming. Both look significantly more impressive after accounting for league-size and factoring on-base percentage, OPS+, total bases, and WAR into the Black Ink and Gray Ink tests.
5). Does the player have uniquely impressive career numbers?
While our primary focus is on finding players with the most elite seasons, we also have to account for those with elite careers. Sometimes there is overlap, and sometimes there isn’t. For example, we’d be hard-pressed to find a truly elite season on Rafael Palmeiro’s ledger. He never led the league in Adjusted OPS+, slugging %, on-base percentage, home runs, or RBIs, and never finished better than 5th in MVP voting. Yet, Palmeiro is a member of one of the most exclusive clubs in baseball history. There have been 32 players to reach 3,000 career hits and 27 to reach 500 career home runs. Only Hank Aaron, Willie Mays, Alex Rodriguez, Albert Pujols, Eddie Murray, and Palmeiro have done both. Although Palmeiro never won an MVP award and rarely led the league in statistical categories, only five players in the history of the game have equaled his combined career production in two of the most important statistics in the sport. Combing for elite seasons using the Black Ink Test (along with on-base percentage, WAR, OPS+, and total bases) unearths the majority of the greatest players of all-time, but some players shine most when looking at career production.
6). How did the player perform in the playoffs?
Few things in the sports world are as intense as playoff baseball. Every strike thrown feels like a statement of dominance, while every ball feels like the precursor to a meltdown. A single base-runner simultaneously represents anxious dread for the defense and the hope of a rally for the offense. Those moments can be as fleeting as Rickey Henderson stealing a base, but hundreds of those moments, back-to-back, over nine innings, results in a tension-filled viewing experience like few others in sports. What makes those moments so exhilarating is the fact that the premier pitching rotations face the most explosive lineups and vice versa. Even when those matchups do occur over the 162-game grind of the regular season, the intensity of the win-or-go-home stakes of the postseason simply cannot be replicated. We can view postseason performance as a bonus data point akin to a partial or full super-competitive regular season.
Derek Jeter played in 158 career playoff games which are roughly equivalent to a full regular season. We can imagine his post-season experience as a single regular season with a degree of difficulty off the charts. Despite exclusively facing the best rotations in baseball in the pressure cooker atmosphere of the postseason, Jeter’s postseason performance stayed true to his regular-season form:
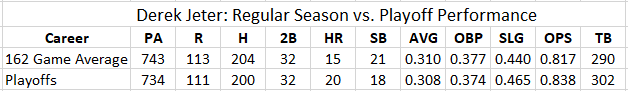
With the slight uptick in power, Jeter’s playoff stat-line would represent one of the better regular seasons of his career. Merely equaling regular season output in the hyper-competitive postseason environment is a sign of elevated performance.
7). Did the player excel in multiple facets?
There’s no doubt that the biggest contribution a position-player can make is with bat-in-hand, but defense and baserunning clearly play a big role in deciding the outcome of a baseball game. Great offensive players get the most recognition—and for good reason—but great offensive players who also excel defensively, or on the base path, are a rare commodity.
Although David Ortiz is proof that it’s possible to mash your way to greatness, his ceiling isn’t nearly as high as it is for a versatile stalwart like Mike Schmidt. Though Schmidt was a celebrated hitter who led the National League in home runs a record eight times, he was also one of the greatest defensive players in MLB history, ranking 8th all-time in dWAR among third basemen. It’s Schmidt’s excellence both with the bat and with the glove that has him ranked among the top-10 players of all-time.
While Schmidt’s elite production with the bat would’ve been enough on its own to merit inclusion in the top-100, there are a number of examples of merely good, or even average, hitters who are included in the top-100 as a result of outstanding defense and/or baserunning. These players include Rickey Henderson, Brooks Robinson, Adrian Beltre, Pudge Rodriguez, Cal Ripken Jr., and Gary Carter. Of course, Barry Bonds, Willie Mays, and Alex Rodriguez also rate among the top-10 players of all-time due, in part, to their versatile skillsets.
8). Was the player uniquely impressive at a critical skill?
By this point of the Q&A, we’ve identified the vast majority of the elite profiles in MLB history. However, there are players hiding in plain sight who were so elite at a critical skill that—despite not having the typical resume of a top-100 player—have earned the right to be listed among the top-100 players of all-time.
Mark McGwire only amassed 1,626 career hits, which isn’t even among the top 500 totals in MLB history. However, McGwire is literally the greatest home run hitter of all-time. His AB/HR rate of 10.61 is the best ever, and it isn’t particularly close. Given that hitting a home run is the pinnacle result of any plate appearance and the fact that McGwire played long enough to clobber 583 home runs, he is undoubtedly one of the top 100 baseball players of all-time, despite being a one-trick pony Cardinal.
Although hitting home runs is the most important skill in baseball, getting on base isn’t far behind, and few have been better at that than Joey Votto. Votto has led the league in on-base percentage seven times. Only Ted Williams, Barry Bonds, Babe Ruth, and Rogers Hornsby have led the league more often, and they just happen to be four of the top-20 players of all-time. Votto will not end up reaching the celebrated statistical milestones that have become synonymous with Hall-of-Fame resumes, but it is hard to imagine a player leading the league in on-base percentage seven times and not being a strong contender for the top-100.
Mariano Rivera is another example of a player who mastered a critical skill. Nobody was better than Rivera at protecting a lead. He is the all-time leader in regular season saves and playoff saves. In fact, he was so dominant at this particular skill that he is the only player in MLB history to be the all-time leader in the same category in both the regular season and the postseason. Typically, a reliever who amassed fewer than 1,200 career regular season innings wouldn’t have anywhere close to the impact a starter would have. However, Rivera didn’t just impact games, he is arguably the most impactful player in postseason history. Rivera’s career postseason Win Probability Added (WPA) of 11.69 is not only the most by any player in history, it is more than the next three players combined.
9). How did the player fare in MVP and Cy Young Voting?
MVP and Cy Young Awards represent the most prestigious annual honors in baseball, so it only makes sense to use them when evaluating player legacies. However, like pretty much every other metric we have at our disposal, MVP and Cy Young voting need to be viewed in context. From 1911-1928, no player was permitted to win the MVP more than once. Also, the MVP was not awarded from 1915-1921 and in 1930. So, using MVP voting for players who played prior to 1930 is pretty much worthless, unless Babe Ruth winning just one MVP award sounds like a reasonable thing.
Additionally, voters inexplicably fell in love with catchers in the 1950s, awarding Yogi Berra and Roy Campanella six combined MVPs between 1951-1955. For comparison, only 11 MVPs have been awarded to catchers in the other 105 years the award has been handed out. As a result of this brief infatuation with catchers, sportswriters of the 50s put us in a tough spot. Only one player in MLB history has won more MVPs than Campanella. Taking MVP voting at face value would mean Campanella would join every other 3-time MVP winner in the top-100. The problem is that the evidence doesn’t support Campanella being the best player in the league even once, let alone three times. Without the MVPs to buoy his resume, Campanella is hardly worthy of top-100 consideration. He only amassed 4,816 plate appearances, yielding an underwhelming 35.6 career WAR. He never finished in the top-6 in single-season WAR and his Black Ink and Gray Ink scores are nowhere near that of a typical Hall-of-Fame player.
We can either take MVP voting at face value and put Campanella in the top-100, or adjust for voting malpractice when necessary. The latter seems to be the more appropriate course of action. Counting some MVP and Cy Young results as legitimate and others as not brings into question the value of using these awards as a metric in the first place. However, more often than not, voters put forth a worthy winner. Even if the occasional voting misfires weren’t palatable, there is also value—maybe even just as much—in simply identifying players who routinely finished among the top-5 in MVP Voting.
Extra Innings
Bonds vs. Ruth
As much as an opinion can be a fact, it has always been a “fact” that Babe Ruth is the greatest baseball player of all-time. It’s an easy case to make. Nobody led the league in more categories more often than Ruth. His entire statistical archive is seemingly bolded or italicized, denoting league-leader status. He is the all-time leader in OPS+ and slugging percentage. He is the only player in baseball history to hit more than 600 home runs and hit at least .305—and he did it with 756 home runs and a .342 average! His dominance of the 20s and 30s essentially forced baseball out of the dead-ball era. It would take thousands of words to list out all of the things Ruth did that nobody else did.
The Sultan of Swat is deserving of every alliterative appellation allocated to him and every hyperbolic half-truth that accompanies his name. Without Ruth, baseball would not be what it is today. He is a two-syllable history lesson of America’s pastime. DJ, kindly bring that record to a screeching halt. This is the “but” you were waiting for. Pee-Wee Herman said it first and said it best, “everyone I know has a big but” and this might be the biggest “but” of them all. Babe Ruth was the greatest player of his era, but he is not the greatest player of all-time. To evoke the moody train conductor from The Polar Express, baseball eras are not transferable. While Ruth’s astronomical statistical marks make him the king of his era, they cannot be taken at face value when comparing him to players from other eras. Ruth’s dominance of an 8-team league entirely devoid of black and Asian players, and largely devoid of Latino, Canadian, and Jewish players, requires loads of context. Additionally, Ruth played in a league that was hesitant to embrace the value of the home run, which made him stand out like a skyscraper in DC. It wasn’t that players couldn’t hit home runs, it’s that they literally didn’t realize they should be trying to. This, of course, wasn’t Ruth’s fault, but it sure made it easier to lead the league in home runs and slugging %. Every subsequent era after Ruth saw a league full of home-run chasing sluggers, meaning nobody after Ruth would have it quite as easy.
The only hitter in MLB history who rivals Ruth in dominance with respect to his era is Barry Bonds. DJ, queue the Death Star theme. Bonds won seven MVP Awards (and should have won two more in 1991 and 2000). That number is significant because, in the history of baseball, no two players have combined to win 7 MVPs. That alone suggests that Bonds is, by far, the greatest hitter since 1931, when the MVP that we recognize today was first handed out. Due to the fact that the MVP didn’t exist from 1915-1921, 1929 (AL), and 1930, and baseball rules prevented players from winning the award more than once from 1922-1928, Ruth’s official MVP count stands at a very unsatisfying one. With a little voodoo magic and some retro-prognostication, it is highly probable that Ruth would’ve come close to equaling Bonds’ seven MVPs. MVP voters have historically shown a penchant for spreading the award around to prevent one player from monopolizing it. So, it is unlikely that Ruth would’ve won the MVP every year that he was statistically the best player. In fact, we have evidence of how (un)likely voters at the time were to vote for him. In 1931, Ruth was clearly the best hitter in the American League, but finished 5th in the voting. Although the number of potential MVP awards Ruth could have won likely falls somewhere between 6-11, the outcome probably would’ve ended up on the lower end of that range.
Let’s just say for argument’s sake that Ruth would have won nine MVPs. During Ruth’s career, there were eight teams in the American League accounting for roughly 200 players. Over the course of Bonds’ career, there was an average of 15 teams in the National League accounting for roughly 375 players. That means that it was close to twice as difficult for Bonds to win an MVP than it was for Ruth. That makes Bonds’ seven MVPs more impressive than the nine MVPs we’ve graciously assumed for Ruth, and that doesn’t account for the fact that Ruth only had to compete against white players.
To continue the Ruth-Bonds comparison in earnest, we need to head to the “league leaders” pages at Baseball Reference, while continuing to account for league size and composition. A similar outcome to the MVP comparison unfolds when comparing Bonds and Ruth in two of the gold-standard measures of inter-era comparisons: WAR for Position Players and OPS+. Both Bonds and Ruth led the league in WAR for Position Players 11 times. Ruth led the league in OPS+ 12 times and Bonds did it nine times. Given that it was almost twice as difficult for Bonds to lead the league in any category due to league size, it’s clear that his accomplishments in these two categories are more impressive than Ruth’s. Again, that only accounts for league size and not the significantly less competitive, very homogenized league that Ruth played in.
Both players led their respective leagues in OBP 10 times. Bonds led the league in walks 12 times, while Ruth did it 10 times. As lauded as Ruth is for his batting average, Bonds led the league in batting average twice, while Ruth did it once. Remember, Bonds simply being close to Ruth in these comparisons is a win given it was nearly twice as difficult for him to lead the league, but Bonds is actually beating Ruth in some of these comparisons. Ruth’s biggest advantage over Bonds comes in slugging percentage where he led the league 13 times compared to Bonds’ seven. Even when it appears Ruth has a significant feather in his cap, the comparison results in a virtual stalemate. It was roughly 1.88 times as difficult for Bonds to lead the league in a category than it was for Ruth, and Ruth led the league in slugging percentage 1.86 times more often than Bonds. That’s about as close to a dead-heat as we’re going to find. Again, that only accounts for the size of the player pool and not the exponential increase in talent that flooded MLB after integration. It also doesn’t account for the fact that leading the league in slugging % was much easier for Ruth given the league was largely ignorant of the value of a home run. Bonds, on the other hand, played in the most competitive home run era in MLB history.
In order for Ruth to stake a claim as the greatest baseball player of all-time, he’d need to come close to doubling-up Bonds in these comparisons, and it hasn’t even come close to playing out that way. Adjusting for league size and composition, Bonds’ achievements are more impressive than Ruth’s, and it’s hard to argue that it’s not by a significant margin. Ruth was an accomplished starting pitcher for the first five years of his career which is certainly notable, but Bonds was an outstanding defensive player and an exceptional base-stealer, while Ruth was not. Let’s call that a wash.
There is no debating Ruth’s dominance or his impact on the sport. He ushered in an entirely new era of baseball by redefining what it meant to be a productive hitter. Bonds’ abrasiveness and PED use make it virtually impossible that he will ever be universally—or even lightly—embraced as the greatest player of all-time. Heck, he can’t even get into the Hall of Fame. Most lists place Ruth as the greatest player of all-time, and most lists will continue to place Ruth as the greatest player of all-time. People aren’t necessarily interested in changing their minds on this, especially when the beneficiary would be Barry Bonds. The goal of this list is not to rank the most likable good players (here’s looking at you, Griffey), rather it is to rank the greatest players of all-time using two overarching themes: dominance within their era and the competitiveness of their era. To go all Married… with Children, “you can’t have one without the other.”
PEDs
The natural rebuttal to the suggestion that Barry Bonds had a more impressive career than Babe Ruth would be to bring up PEDs. I’m going to break character and rock singular first person here because this is all about personal preference. I made the decision before putting this list together that I would not factor in PED use when ranking players. My reasoning centers around six basic ideas:
1) Players have been cheating in baseball for years in some form or another. Punishing PED usage and not, say, ball-doctoring, bat-corking, electronic surveillance, or greenie-popping seems inconsistent and arbitrary.
2) It is unlikely that we know even half of the players who took PEDs, which means those who don’t get caught get to hide in plain sight. It’s akin to playing Clue with missing game pieces. There are almost certainly PED users currently in the Hall of Fame who skipped the disgraced player queue simply due to dumb luck. Punishing known users would undoubtedly result in elevating what is sure to be an even bigger group of unknown PED-users. It would also elevate those who cheated in other capacities.
3) Outrage over PED use in professional sports seems to be limited to baseball. PED-use is a wildfire in the NFL, and nobody cares. It’s even worse in MMA when adjusting for the size of the athlete pool. I don’t see the point in treating PED use differently depending on the sport.
4) Even if I chose to “punish” known PED users, there is no formula for how much to devalue statistical performance. Sure, I could randomly penalize Bonds 15 spots, but what would be the rationale behind choosing that number? What if by doing so, Bonds lands behind a suspected-but-not-proven PED user? The integrity of the list starts to break down in a hurry by attempting to police what is impossible to police.
5) Most of the prolific hitters of the steroid-era allegedly took PEDs, putting the vast majority of players in that era on an even playing field. Bonds led the league in WAR for Position Players 11 times. He did it in a league that was full of players using PEDs. Had Bonds been the only player juicing, then we might feel emboldened to question the validity of his dominance. Instead, he achieved the 3rd highest career Adjusted OPS+ of all-time competing against a league full of supercharged players. That’s pretty impressive. As long as we focus our inter-era player comparisons on performance relative to the league average, we can somewhat mute the impact of PEDs.
6) Regardless of my personal view on the matter, opinions on PED use in baseball range from indifference to outrage, and everywhere in between. By removing PED use as a factor in these rankings, I’m giving the responsibility to account for PED use to you—my eminently awesome reader—to adjust as you see fit, or not at all. If you want to draw a red line through every suspected cheater, then in my best Bobby Brown voice, that’s your prerogative. If you simply want to take the list for what it is—which is strictly a performance-based representation of the greatest players in history—then have at it. I would much rather outsource this responsibility than attempt to be the only voice on such a divisive issue.
Escaping the Gravitational Pull of Conventional Wisdom
If there’s one constant in baseball, it’s that player legacies age like Salma Hayek. This isn’t surprising, of course, since the first thing we’re taught from the jump is to revere baseball’s sacred past. It’s no coincidence that we literally call it “America’s Pastime.” Honoring history is cool and all, but when it comes at the expense of the present, we need to take a step back and find some context. In 1998, Sporting News released its list of the top-100 players in baseball history. Of the players in the top-25, a whopping 18 had made their professional baseball debut by 1940. There wasn’t a single player in the top-25 who debuted after 1967 and only two players who debuted after 1956. If we’re to believe the Sporting News in 1998, the 66 years from 1890-1956 produced 23 of the 25 greatest players all-time, while the following 42 years produced two. If this was a problem on the AP Statistics exam, I think the Sporting News would’ve failed miserably. Sporting News isn’t the only outlet to disproportionately favor players from the past. Publication-after-publication continues to follow suit, saturating lists with players who played 100 years ago, when the sport was at its weakest competitively. If all we’re interested in is a quick fix of nostalgia, then we can continue stamping every list with the same players. However, if we’re legitimately interested in a statistically sound distribution of the greatest players to ever play, we need to start fighting back against the pull of history.
For 60 years, MLB baseball was as homogenized as a cold, very delicious, very white glass of milk. During this time, black players were banned, anti-Semitism was rampant, and the player pool was hardly the global behemoth that it is today. This limited player pool made it much easier for top players to stand out statistically than in any other era of baseball, leading to ludicrously high OPS+ and batting averages that are exclusive to the early days of baseball. As the player pool grew over time, and the makeup of the pool became more diverse, standing out became increasingly difficult. Unfortunately, some of our best baseball historians have done a poor job explaining this, instead choosing to revel in the astronomical statistical outputs from a century ago. This is how we arrive at a place where much of the baseball world believes that upwards of half of the greatest players of all-time played prior to desegregation.
Once an idea has latched on, it is very difficult for us to let go, even in the face of overwhelming evidence. This is especially true if the idea is sown in adolescence. Ask any adult who discovered America to test this out. For many baseball fans, it is simply a fact that Babe Ruth is—and always will be—the greatest baseball player of all-time, and to suggest otherwise is blasphemous. We have to be willing to challenge conventional wisdom when the evidence supports such a conclusion. If we continue to ignore statistical performance within the context of competition level, then we can expect Sporting News to dust off its 1998 list and present it as new in 2098.
Player Pool Thought Experiment
Let’s imagine we’re spontaneously transported back to our 5th grade classroom. We’re greeted with all the old standbys; cement walls weirdly painted white, sweet laminated posters with inspirational quotes, and the clock above the chalkboard taunting us with its impossibly slow pace. We also might find that our teacher has scheduled a spelling bee in honor of our interdimensional visit. Motivation aside, what might our odds be of winning this adolescent rite of passage? Well, that all depends on whether we’re shooting for classroom superiority, world domination, or somewhere in between. If we’re limiting the competition to just the 5th grade—and just our classroom—we’re looking at a 1 in 30 shot to win the belt, maybe a little higher since we’ve already taken high school lit. That jumps to 1 in 90 for school supremacy, and 1 in 540 for district supremacy, respectively. Things start getting bananas after that. The county and state bees come in at roughly 1 in 20,000 and 1 in 100,000, while the national bee jumps to 1 in 4 million. If we want world domination, we’ve got our work cut out for us at 1 in 100 million. As the pool of spellers grows, the odds of conquering the competition decrease rapidly. Even though the winner at each level has dispatched all challengers, surely, we wouldn’t expect the winner of a classroom bee to have the vocabulary capacity of a state winner. As Daniel Cormier would say, “there are levels to this game.”
So, how does this fit within the context of baseball? Fantastic question! As late as 1920, dedicated youth baseball leagues didn’t even exist in the U.S., let alone in other countries. Without youth leagues to drive competition, standing out was a relatively easy proposition for those who were fortunate enough to be exposed to the game. For a modern comparison, think niche/geographic sports like lacrosse. The player pool was further limited by the fact that MLB was reserved for white players only, despite baseball being popular in the black community. Fast-forward a century and the whole world has been hit by a tidal wave of baseball mania. Our global infatuation has prompted ESPN to broadcast every game of the Little League World Series—baseball games played by 10-12-year-olds—to its massive viewing audience. The impact this movement has had on the pool of talent feeding MLB has been profound. In 2020, over 28% of MLB players on Opening Day rosters were born outside the U.S., and in 2018, people of color made up 42.5% of all MLB players, up slightly from the 0% in 1910. Not to be outdone by the increasing popularity abroad, baseball participation in the U.S. has also undergone a vast expansion. In 2017, over 15 million people played organized baseball in the U.S. alone. For comparison, there were only 16 million white males age 5-24 in the entire country in 1910.
The talent pool supplying players to MLB in 1910 was a pond compared to the ocean that we see today. Any comparison between two players from these respective eras needs to be made with degree-of-difficulty front and center. For instance, we might look at Walter Johnson being the best pitcher in 1910 as, say, a national spelling bee champion (1 in 4 million), while Randy Johnson being the best pitcher in 2000 might be closer to a world spelling bee champion (1 in 100 million). Both can stake the claim of being the best of their pool, but to suggest their accomplishments should be viewed equally would be a disservice to statistical analysis. So, now that we’re on the subject…
Let’s Talk About Randy
“Who is the greatest pitcher of all-time?” The names that get thrown around when that question comes up typically include some combination of Walter Johnson, Lefty Grove, Grover Cleveland Alexander, Christy Mathewson, and perhaps Roger Clemens, depending on how we’re all feeling about PED use on that given day. Cy Young will occasionally get an honorary O.G. mention, but the candidates usually don’t extend beyond that group. A name we don’t often hear in the mix as the pitching GOAT is Randy Johnson. This isn’t to suggest The Big Unit has been disregarded; it is commonplace to find him among the top-10 on pitching lists. However, there is a pretty significant disconnect between “the top 10” and the straight fire that is on Randy’s resume. We can blame that disconnect squarely on our obsession with baseball’s past. The Big Unit’s only sin is that he wasn’t born 70 years earlier. There is no other explanation for why he isn’t a perennial contender for not only the greatest pitcher of all-time but also the greatest player of all-time.
Before we take a deep dive into the numbers, let’s first establish the competition level Randy faced compared to the other GOAT candidates. Aside from Clemens, all the pitchers listed above played during segregation. Not only were there no black players, but there were also no Asian players and very few Latinos (most were forced to play in the Negro Leagues), Canadians (43 of the 45 Canadian MLB All-Star selections have come since 1940), and Jewish players (all 71 Jewish All-Star selections came after 1936). Imagine how much easier it would be to succeed as a pitcher in today’s game if black, Latino, Canadian, Asian and Jewish players were either largely, or completely, excluded. Randy’s already stellar ERA would shine even brighter like a diamond in a world without diversity. No Barry Bonds. No Albert Pujols. No Manny Ramirez. No Miguel Tejada. No Carlos Beltran.
We also have to recognize that while W. Johnson, Mathewson, Alexander, and Young pitched in the dead-ball era, Randy’s career landed him right smack dab in the middle of the steroid era, home to the greatest single-season home run totals in MLB history. Then comes the adjustment for league size. In 1910 a pitcher would need to be better than only 39 other starting pitchers to be considered the best in the league (assuming five-man rotations intact for the season). Today, a pitcher needs to be better than 74 other starting pitchers to achieve the same distinction. Any fair comparison between Randy Johnson and the aforementioned Hall of Fame pitchers needs to place “degree of difficulty” front and center. Anything less would be uncivilized.
Now that we’ve unintentionally made the case for every pitcher who pitched in the 90s, let’s delve into the numbers so we’re not anointing someone simply for pitching in one of the most turbulent eras in baseball history. Let’s see if we can do this in one breath… Randy won five Cy Young Awards, and finished second three times. Only Roger Clemens equals Randy’s combined total of eight first and second-place finishes. Randy won four consecutive Cy Young Awards. Greg Maddux, also with four consecutive Cy Youngs, is the only other player to win at least three in a row. Randy is the only player in MLB history to win a Cy Young Award in each league and finish 2nd in each league. Randy led the league in adjusted ERA+ six times. Only Lefty Grove and Clemens led the league more often. He led the league in H/9 six times. Only Nolan Ryan led the league more often. He led the league in winning % four times. Only Grove led the league more often. He led the league in strikeouts nine times. Only Walter Johnson and Nolan Ryan led the league more often. He is the only player since 1920 to lead the league in ERA+ and strikeouts six times. He’s the only pitcher since the dead-ball era to lead the league in complete games four times and ERA+ six times. He is the only player since 1920 to lead the league in WHIP three times and strikeouts nine times. Randy and N. Ryan are the only pitchers to lead the league in strikeouts for four consecutive seasons on two different ocassions. Randy and N. Ryan are the only two pitchers to record 300+ strikeouts in four consecutive seasons. Of pitchers who pitched a minimum of 2,500 career innings, Randy has the highest K/9 in history. He holds the record for most strikeouts in a nine-inning start and most strikeouts in a relief appearance. He led the league in WAR for pitchers six times. Only Grove, Clemens, and W. Johnson led the league more often. He led the league in Win Probability Added (WPA) four times. Only Clemens and Grove led the league more often. He’s 2nd on the all-time strikeout list. He’s one of only four pitchers to reach 300 wins among players who debuted after 1967. Among players to debut since 1967, only Clemens has more shutouts. He is one of only seven players in MLB history to pitch a perfect game and a no-hitter. He’s the only pitcher in MLB history to lead the league in winning % four times and throw two no-hitters. He’s the only pitcher in MLB history to lead the league in ERA+ six times, strikeouts six times (again, he did it nine), and throw two no-hitters. I’m starting to think trying to do this in one breath was a bad idea.
Before some of us start passing out, let’s quickly hit the playoffs with the shared understanding that we could continue this exercise for another 2,000 words. Deal? Deal. Randy had one of the greatest postseason performances in the history of baseball when he—and Curt Schilling—led Arizona to a World Series victory over the Yankees in 2001. In 41.3 postseason innings that year, he went 5-1 with two shutouts, a 1.53 ERA, and a .77 WHIP. Having pitched Arizona to victory in game six, he entered game seven on one days rest to get the final four outs. He holds the record for most wins in a single postseason. He is the only pitcher since 1968 to win three games in a single World Series. He is the only pitcher in MLB history with four Cy Young Awards (he has five) and a World Series MVP.
Based on performance relative to the league, the pitchers who pop up the most alongside Randy Johnson are Lefty Grove and Roger Clemens. Grove played before integration. He also played in a league roughly half the size, making Randy’s league-leading accomplishments far more impressive. Clemens is a different monster altogether largely due to peak longevity. Randy didn’t start pounding out elite seasons until he was 29. Although that underscores just how dominant he was after the age of 30, it is also the reason for Clemens’ massive 22-12 edge in career peak length in years. If we’re taking resumes at face value, then it’s hard to choose anyone other than Clemens as the pitching GOAT. If we start to discount accomplishments due to PED use, then Randy inches closer to the throne. Regardless of whether we choose to weigh PED use or not, there is no reasonable explanation for Randy Johnson to rank any lower than second on the all-time pitching list.
MLB only, regrettably.
Racial segregation will forever be a stain on the history of our species. The very idea of it is insulting to our big and brilliant brains and the evolutionary process that led to them. Despite being virtually indistinguishable at the cellular, skeletal, and muscular levels, too many of us have used those big brains to conclude that variations in skin pigmentation based on how far our ancestors lived from the equator 100,000 years ago are simply too much adversity to overcome. While racism has far more important consequences than its impact on baseball, it’s hard not to be bitter that this own-goal is the reason Babe Ruth and Josh Gibson never played in the same league.
Baseball history prior to integration is like an unopened milk carton that has been sitting on the counter for a week. It looks every bit like the cold and creamy drink fit to be paired with a warm, gooey chocolate chip cookie. We can hold on to that narrative as long as we’d like if we don’t have any intention of opening the milk. The moment we twist the cap the rotten odor of reality spoils our illusions, and we’re left wondering why someone couldn’t have just put the milk in the fridge. Despite looking like baseball’s most fascinating era, the golden age of baseball was spoiled by segregation, leaving us the cruel fate of pondering what might have been. With all due respect to Ray Kinsella, my Field of Dreams features Josh Gibson, Cool Papa Bell, Oscar Charleston, Buck Leonard, and Satchel Paige playing a career’s worth of games with and against Babe Ruth, Ty Cobb, Rogers Hornsby, Jimmie Foxx, and Walter Johnson. Only then could we take the accomplishments of the latter group at face value. The stars of MLBs bygone era got off easier than they ever had a right to.
Given that Hank Aaron and Willie Mays went from the Negro Leagues to MLB MVP to the Hall of Fame—and the fact that Satchell Paige made the MLB All-Star Game at 46 some twenty years removed from his prime—there is little doubt that the best Negro League players were every bit as skilled as their MLB counterparts. The same can likely be said of the top stars in Latin America, who were also banned due to the GPS coordinates of their ancestors 100,000 years ago. While it is obvious that Negro League players as a whole were more than capable of thriving in MLB, what isn’t obvious is how each individual player would’ve performed. It’s hard enough to compare players with two wildly different MLB profiles, let alone players who didn’t compete against each other and had zero common opponents. Given the limited number of games on the Negro League schedule and the lack of dedicated reporting from that era, it would be difficult to rank Negro League players against each other let alone against players from a different league.
So, that leaves me with two choices: confine the list to MLB competition, or randomly sprinkle Negro League players into the top-100 to ostensibly achieve harmony. As tempting as the second option sounds, there’s only one choice that makes sense. Josh Gibson might have been the greatest baseball player of all-time. He might have been the 101st greatest player of all-time. I’m not sure what I’m supposed to do with that. I’ll forego the random placement option, and instead promote the frickin’ sweet Seamheads website as well as leave you with the all-time WAR leaders in Negro Leagues history.
Is the increase in NBA scoring due to changes in defensive strategies, offensive tactics, rule changes, player skill level, or a combination of these factors?
https://www.the100greatest.com/2021/03/04/trickle-down-statistics-in-the-nba-and-rudy-gobert/