
It would be easy to look at the offensive explosion in the NBA over the last five years and call into question player attitudes towards defense. Since defending is equal parts technique and effort, it stands to reason that a significant increase in scoring would be a reflection of defensive effort. Interestingly, this is one of the few times where logic lets us down. While it is technically true that defenses are performing worse (i.e., allowing more points), it turns out that defensive effort is either an insignificant factor or not a factor at all. A fancy tool we have at our disposal to help illuminate this is shot distribution by distance. The offensive uptick in the NBA has paradoxically coincided with NBA players attempting more difficult shots instead of fewer. We can hardly blame NBA defenses for this unexpected development. To get a better idea of the root cause(s) of the NBA’s pinball point totals, let’s take a look at some surprising trends.
Up first on our to-do list is to separate the signal from the noise. Scoring is up in the NBA, and it’s up big-time. In the 2011-2012 NBA season, teams averaged 96.3 points per game. That number has skyrocketed to over 112 points per game today. It’s important to note that pace—or the number of possessions per game—has also increased significantly, which would naturally lead to an increase in scoring even if the league-average field goal percentage remained steady. More possessions = more points.
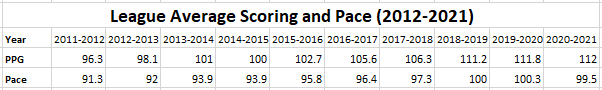
NBA teams are averaging 8.2 more possessions per game in 2021 than in 2012. Assuming a conservative 1.08 points per possession, that gives us 8.64 more points per game from the increase in pace alone. The 8.64-point increase only represents 55% of the 15.7-point overall points per game increase since 2012. Where is the rest coming from?
Those of us who have spent hours (or thousands of hours) playing 3-on-3 at the local gym know that layups and 3s keep you on the court. The mid-range game is your ticket to a 45-minute wait in the crowded queue of gym rats and weekend warriors. That has been a way of life in pick-up basketball long before Allen Iverson made it cool to clank the iron. The layups or 3s approach is pretty easy to explain using some nifty 6th-grade math. The league average shooting percentage in the NBA for a long-two (beyond 16 feet) is around 40%, or .8 points per possession (40% x 2 possible points). The league average shooting percentage in the NBA for 3-pointers and layups is 38% and 67%, respectively, resulting in 1.14 (38% x 3 possible points) and 1.34 (67% x 2 possible points) points per possession. The math confirms that three-pointers and layups are the way to go.
Curiously, the NBA seemed oblivious to this remedial math lesson for more than 60 years, instead opting to canonize the mid-range jumper. Many seasons and many inefficient players later, the layups or 3s philosophy finally hit the NBA within the last decade, spreading like wildfire. In just 10-seasons, three-point attempts have gone up an unbelievable 74%. Over the same period, long-twos have gone down 64%, currently representing only 7% of total shot attempts as the league has started to view them as the reckless gambles they are.
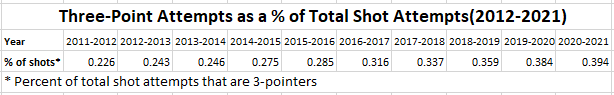
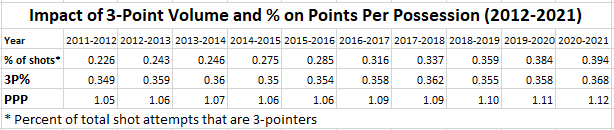
While the increase in 3-point shot attempts alone would be enough to increase points per possession, something unexpected happened along the way that has accelerated the increase even more. NBA players didn’t just start taking more 3-point shots, they started making them more often. In 2011-12, when 22.6% of total shot attempts were 3-pointers, the leaguewide 3-point shooting percentage was 34.9%. In 2020-21, 3-pointers are accounting for 39.4% of shot attempts, while the league average 3-point shooting percentage has increased to an astounding 36.8%. The upticks in both three-point attempts and three-point shooting percentage have combined to produce the five highest league average Points Per Possession seasons of all-time in just the last five years, culminating in 2021’s bonkers mark of 1.12.
With all due respect to the Showtime 80s, this quicker-paced, more efficient style of play has arguably produced the most exciting brand of basketball the NBA has ever seen. The byproduct of that development is that playing defense in the NBA—and accumulating defensive stats—has never been more challenging. The layups or 3s offensive approach has had a massive trickle-down effect on several counting statistics that we’ve historically leaned on to measure defensive impact. Here are some examples:
- With more attempts coming from behind the arc, fewer shots are closely-contested, causing block shots to plummet. The five fewest Block Shots Per 100 possessions seasons in NBA history have come in the last five years.
- With more attempts coming from behind the arc and coming sooner in the shot clock, the number of overall passes and the number of “risky” passes (passes made in traffic inside the arc) are down, causing steals to drop significantly. The three fewest Steals Per 100 Possessions seasons in NBA history have come in the last three years.
- With more attempts coming from behind the arc and three-point shooting percentage rising, defensive eFG% allowed has skyrocketed. The seven highest eFG% seasons have all come in the last seven years.
- The increase in pace and opponent eFG% has caused teams to emphasize getting back on defense as quickly as possible to avoid giving up transition opportunities, abandoning the pursuit of offensive rebounds in the process. The four lowest Offensive Rebounding % seasons have all come in the last four years.
- NBA defenders have historically benefited from having the option to foul an opponent before allowing a high-percentage attempt close to the basket, artificially limiting points per possession. That option simply doesn’t exist when defending a 3-point shooter. With more shot attempts coming from behind the arc, fewer attempts are coming near the basket where most fouls occur, causing fouls to drop. The five fewest Fouls Per 100 Possessions seasons in NBA history have all come in the last five years.
As increases in offensive efficiency and pace have put more pressure on defenses, we’ve seen steals, blocks, offensive rebounding, and fouls per 100 possessions plunge. Since raw inter-era per-game and per-possession comparisons of these statistics offer little value, we need to find a better way to compare present-day defenders to their predecessors. Any inter-era player comparison needs to consider two factors: 1) degree of difficulty (or strength of the league) and 2) performance relative to peers. Since modern defenders face the highest degree of difficulty in NBA history, we can use performance relative to peers without limitation. Let’s look at how an elite modern defender compares to elite defenders from different eras using performance relative to the league average.
Rudy Gobert is the premier defensive center in the NBA today. He is a two-time Defensive Player of the Year winner, a four-time 1st Team All-Defensive selection, the active leader in Block % and is on pace to become the active leader in Defensive Rating. Unsurprisingly, Gobert’s per game marks are underwhelming compared to centers from eras with more action inside the three-point line. Fortunately, we can lean on performance relative to peers to provide a more fair comparison.
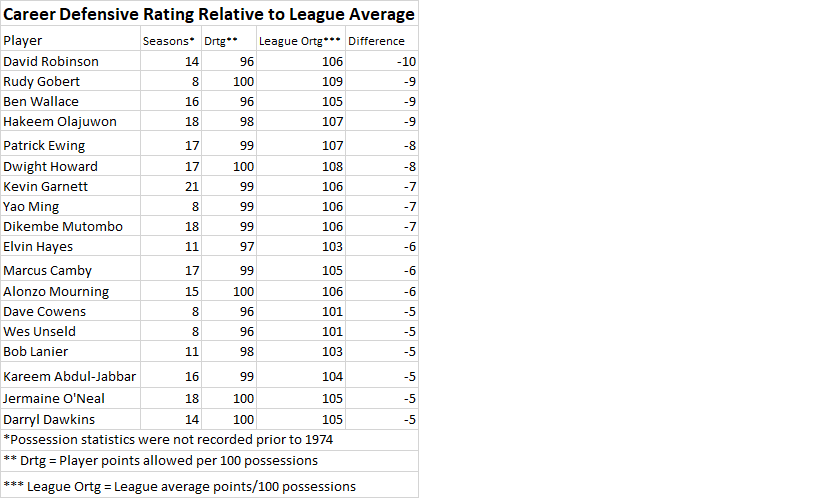
The only player in NBA history who has performed better relative to the league average than Gobert is David Robinson. Skyrocketing field goal percentages, an increased pace, and globalization that has produced superstars like Giannis, Nikola Jokic, and Luka Doncic, make Gobert’s NBA competition significantly more challenging than what Robinson faced. Gobert is only 28 and currently having his best defensive season yet relative to the league average, so it’s not hyperbole to suggest that Gobert is on his way to becoming one of the greatest—if not the greatest—defensive centers of all-time. Longevity matters, of course, but after eight seasons, Gobert couldn’t be off to a better start. If we merely focused on raw Defensive Rating in our comparison, then Robinson would win in a landslide. Robinson’s ten best seasons according to Defensive Rating are better than any season Gobert has ever had. It’s only when we remove pace from the equation and make the comparison using performance relative to the league average that we get a true measure of Gobert’s contributions.
While the NBA may have been slow to adapt, the focus on points per possession is not a recent phenomenon. Dean Smith incorporated it into his offensive philosophy as early as the 1960s, while another Dean—Dean Oliver—brought the terminology into our everyday vernacular with his focus on points per 100 possessions or, as he calls it, Offensive Rating (ORtg). As players, coaches, and front offices have adopted points per possession as a crucial metric, the efficiency—or inefficiency—of shot selection has never been more scrutinized. In turn, we need to make sure we’re understanding the defensive ramifications of this philosophical shift, or we are destined to underrate modern defenders and potentially miss out on historical greatness right in front of our eyes.